Tuesday, July 12, 2016

Collecting Prometheus Data and Storing in Hawkular

My last blog entry talked about how to collect JMX data via Jolokia and store that data in Hawkular. Another relatively unknown feature similar to that, which I will now describe in this blog entry, is the ability to collect Prometheus metric data and store that in Hawkular.

Prometheus is itself a metric collection and storage system. However, Prometheus data endpoints (that is, endpoints that emit Prometheus metric data) follow a specific format for the emitted metric data. The Hawkular WildFly Agent has the ability to parse this Prometheus metric data format and push that metric data for storage into Hawkular which can then, of course, be used by Hawkular and its clients (for the purposes of graphing the metric data, alerting on the metric data, etc.).

I will explain how you can quickly get Hawkular to collect metric data from any Prometheus endpoint and store that data into Hawkular.

First, you need a Prometheus endpoint that emits metric data! For this simple demo, I simply ran the Prometheus Server which itself emits metrics. I did this via docker:

1. Make sure your docker daemon is running: sudo docker daemon
2. Run the Prometheus Server docker image: sudo docker run -p 9090:9090 prom/prometheus

That's it! You now have a Prometheus Server running and listening on port 9090. To see the metrics it, itself, emits, go to http://localhost:9090/metrics. We'll be asking the Hawkular WildFly Agent to collect these metrics and push them into a Hawkular Server.

Second, you need to run a Hawkular Server. I won't go into details here on how to do that. Suffice it to say, either build or download a Hawkular Server distribution and run it (if it is not a developer build, make sure you run your external Cassandra Server prior to starting your Hawkular Server - e.g. sudo docker run cassandra -p 9042:9042).

Now you want to run a Hawkular WildFly Agent to collect some of that Prometheus metric data and store it in the Hawkular Server. In this demo, I'll be running the Swarm Agent, which is simply a Hawkular WildFly Agent packaged in a single jar that you can run as a standalone app. However, its agent subsystem configuration is the same as if you were running the agent in a full WildFly Server so the configuration I'll be describing can be used no matter how you have deployed your agent.

Rather than rely on the default configuration file that comes with the Swarm Agent I extracted the default configuration file and edited it as I describe below.

I deleted all the "-dmr" related configuration settings (metric-dmr, resource-type-dmr, remote-dmr, etc). I want my agent to only collect data from my Prometheus endpoint, so no need to define all these DMR metadata. (NOTE: the Swarm Agent configuration file does already, out-of-box, support Prometheus. I will skip that for this demo - I want to explicitly explain the parts of the agent configuration that is needed to be in the configuration file).

The Prometheus portion of the agent configuration is very small. Here it is:
<managed-servers>
  <remote-prometheus name="My Prometheus Endpoint"
                     enabled="true"
                     interval="30"
                     time-units="seconds"
                     metric-tags="feed=%FeedId"
                     metric-id-template="%FeedId_%MetricName"
                     url="http://127.0.0.1:9090/metrics"/>
</managed-servers>
That's it. <remote-prometheus> tells the agent where the Prometheus endpoint is and how often to pull the metric data from it. Every metric emitted by that Prometheus endpoint will be collected and stored in Hawkular.

Notice I can associate my managed server with metric tags (remote-prometheus is one type of "managed server"). For every metric that is collected for this remote-prometheus managed server, those tags will be added to those metrics in the Hawkular Server (specifically in the Hawkular Metrics component). All metrics will have these same tags. In addition, any labels associated with the emitted Prometheus metrics (Prometheus metric data can have name/value pairs associated with them - Prometheus calls these labels) will be added as Hawkular tags. Similarly, the ID used to store the metrics in the Hawkular Metric component can also be customized. Both metric-tags and metric-id-template are optional. You can also place those attributes on individual metric definitions (which I describe below) which is most useful if you have specific tags you want to add only to metrics of a specific metric type but not on all of the metrics collected for your managed server.

If you wish to have the agent only collect a subset of the metrics emitted by that endpoint, then you must tell the agent which metrics you want collected. You do this via metric sets:
<metric-set-prometheus name="My Prometheus Metrics">
  <metric-prometheus name="http_requests_total" />
  <metric-prometheus name="go_memstats_heap_alloc_bytes" />
  <metric-prometheus name="process_resident_memory_bytes" />
</metric-set-prometheus>
Once you defined your metric-set-prometheus entries, you specify them in the metric-sets attribute on your <remote-prometheus> element (e.g. metric-sets="My Prometheus Metrics").

OK, now that I've got my Swarm Agent configuration in place (call it "agent.xml" for simplicity), I can run the agent and point it to my configuration file: 
java -jar hawkular-swarm-agent-dist-*-swarm.jar agent.xml
At this point I have my agent running along side of my Hawkular Server and the Prometheus Server which is the source of our metric data. The agent is collecting information from the Prometheus endpoint and pushing the collected data to Hawkular Server.

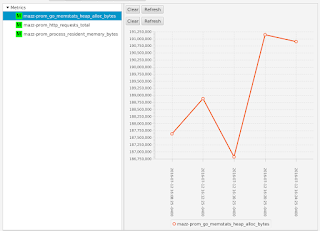
In order to visualize this collected data, I'm using the experimental developer tool HawkFX. This is simply a browser that let's you see what data is in Hawkular Inventory as well as Hawkular Metrics. When I log in, I can see all the metric data that comes directly from the Prometheus endpoint.
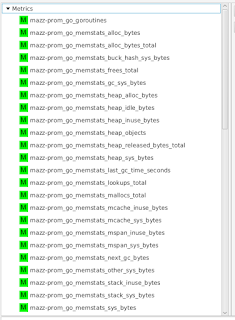


I can select a metric to see its graph:
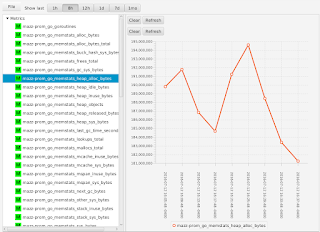


If I were to have configured my agent to only collect a subset of metrics (as I had shown earlier), I would see only those metrics that I asked to collect - all the other metrics emitted by the Prometheus endpoint are  ignored:


What this all shows is that you can use Hawkular WildFly Agent to collect metric data from a Prometheus endpoint and store that data inside Hawkular.

Collecting JMX Data and Storing in Hawkular

The Hawkular WildFly Agent has the ability to not only monitor WildFly Servers but also JMX MBean Servers via Jolokia (and also Prometheus endpoints, but that's for another blog - let's focus on Jolokia-enabled JMX MBean Servers for now).

What this means is if you have a Jolokia-enabled server, you can collect JMX data from it and store that data in Hawkular. This includes both metric data as well as resource information.

This blog will attempt to quickly show how this is done.

First, you need a Jolokia-enabled server! For this demo, here's the quick steps I did to get this running on my box:

1. I downloaded WildFly 10.0.0.Final and unzipped it.
2. I downloaded the latest Jolokia .war file and copied it to my new WildFly Server's standalone/deployments directory
3. I started my WildFly Server and bound it to some IP address that I dedicated to it (in this case, it was simply a loopback IP that I dedicated to this WildFly Server):

bin/standalone.sh -b 127.0.0.5 -bmanagement=127.0.0.5

At this point, I now have a server with some JMX data exposed over the Jolokia endpoint.

Second, I need to run a Hawkular Server. I won't go into details here on how to do that. Suffice it to say, either build or download a Hawkular Server distribution and run it (if it is not a developer build, make sure you run your external Cassandra Server prior to starting your Hawkular Server - e.g. sudo docker run cassandra -p 9042:9042).

Now I want to run a Hawkular WildFly Agent to collect some of that JMX data from my WildFly Server and store it in Hawkular Server. In this demo, I'll be running the Swarm Agent, which is simply a Hawkular WildFly Agent packaged in a single jar that you can run as a standalone app. However, its agent subsystem configuration is the same as if you were running the agent in a full WildFly Server so the configuration I'll be describing can be used no matter how you have deployed your agent.

Rather than rely on the default configuration file that comes with the Swarm Agent (which is designed to collect and store data from a WildFly Server's DMR management endpoint, not Jolokia) I extracted the default configuration file and edited it as I describe below.

I deleted all the "-dmr" related configuration settings (metric-dmr, resource-type-dmr, remote-dmr, etc). I want my agent to only collect data from my Jolokia endpoint, so no need to define all these DMR metadata.

I then added metadata that describes the JMX data I want to collect. For example, I collect availability metrics (to tell me if an MBean is available or not) and gauge metrics (to graph things like used memory). I also collect resource properties that some MBeans expose as JMX attributes. I assign these to different resources by defining resource metadata which point to specific JMX MBean ObjectNames. I then define the details of my Jolokia-enabled WildFly Server in a <remote-jmx> so my agent knows where my Jolokia-enabled WildFly Server is.

Some example configuration is:
<avail-jmx name="Memory Pool Avail"
           interval="30"
           time-units="seconds"
           attribute="Valid"
           up-regex="[tT].*"/>
This defines an availability metric that says for the attribute "Valid" if its value matches the regex "[tT].*" consider its availability UP (note this regex matches the string "true", case-insensitive), otherwise it is DOWN. We will attach this availability metric to a resource below.

Here is an example of a gauge metric:
<metric-jmx name="Pool Used Memory"
            interval="1"
            time-units="minutes"
            metric-units="bytes"
            attribute="Usage#used"/>
Notice the data can come from a sub-attribute of a composite value (the "used" value within the composite attribute "Usage").

You group availability metrics and numeric metrics in metric sets (avail-set-jmx and metric-set-jmx respectively) and then associate those metric sets to specific resource types. Resource types define resources that you want to monitor (resources in JMX are simply MBeans identified with ObjectNames). For example, in my demo, I want to monitor my Memory Pools. So I create a resource type definition that describe the Memory Pools:
<resource-type-jmx name="Memory Pool MBean"
         parents="Runtime MBean"
         resource-name-template="%type% %name%"
         object-name="java.lang:type=MemoryPool,name=*"
         metric-sets="MemoryPoolMetricsJMX"
         avail-sets="MemoryPoolAvailsJMX"
  <resource-config-jmx name="Type"

                       attribute="Type"/>
</resource-type-jmx>
Here you can see my resource type "Memory Pool Bean" refers to all resources that match the JMX query "java.lang:type=MemoryPool,name=*". For all the resources that match that query, I associate with them the availability and numeric metrics defined in the sets mentioned in the metric-sets and avail-sets attributes. I also want a resource configuration property collected for each resource - "Type". Each Memory Pool MBean has a Type attribute that we want to collect and store. Notice also that all of these resources are to be considered children of the parent resource whose resource type name is "Runtime MBean" (which I defined elsewhere in my configuration).

Once all of my metadata is configured (I've configured the agent to collect all the configuration properties, availability and numeric metrics of all the JMX MBeans I want), I now configure the agent with the Jolokie-enabled endpoint. This tells the agent how to connect to the Jolokia endpoint and what I want the agent to monitor in that endpoint:
<remote-jmx name="My Remote JMX"
  enabled="true"
  resource-type-sets="MainJMX,MemoryPoolJMX"
  metric-tags="server=%ManagedServerName,host=127.0.0.5"
  metric-id-template="%ResourceName_%MetricTypeName"
  url="http://127.0.0.5:8080/jolokia-war-1.3.3"/>
Here I configure the URL endpoint of my WildFly Server's Jolokia war. I then tell it what resource types I want to monitor in that Jolokia endpoint (I've grouped all my resource types into two different resource type sets called MainJMX and MemoryPoolJMX). The grouping is all up to you - if you want one big resource type set, that's fine. For metrics, you can have one big availability metric set and one big numeric metric set - it doesn't matter how you organize your sets.

One final note before I run the agent. Notice I can associate my managed server with metric tags (remote-jmx is one type of "managed server"). For every metric that is collected for this remote-jmx managed server, those tags will be added to those metrics in the Hawkular Server (specifically in the Hawkular Metrics component). So for the "Pool Used Memory" metric I defined earlier, when that metric is stored in the Hawkular Server, it will be tagged with "server" and "host" where the values of those tags are the name of my managed server (in this case, %ManagedServerName is replaced with "My Remote JMX") and "127.0.0.5" respectively. All metrics will have the same tags. Similarly, the ID used to store the metrics in the Hawkular Metric component can also be customized though this is a rarely used feature and you probably will never need it. Both metric-tags and metric-id-template are optional. You can also place those attributes on individual metrics which is most useful if you have specific tags you want to add only to metrics of a specific metric type but not on all of the metrics collected for your managed server.

OK, now that I've got my Swarm Agent configuration in place (call it "agent.xml" for simplicity), I can run the agent and point it to my configuration file:
java -jar hawkular-swarm-agent-dist-*-swarm.jar agent.xml
At this point I have my agent running along side of my Hawkular Server and WildFly Server enabled with Jolokia. The agent is collecting information from Jolokia and pushing the collected data to Hawkular Server.

In order to visualize this collected data, I'm using the experimental developer tool HawkFX. This is simply a browser that let's you see what data is in Hawkular Inventory as well as Hawkular Metrics. When I log in, I can see all the resources stored in Hawkular that comes directly from Jolokia - these resources represent the different JMX MBeans we asked the agent to monitor:


You can see "My Remote JMX Runtime MBean" is my parent resource, it has one availability metric "VM Avail", three numeric metrics and six child resources (those are the Memory Pool resources described above when we added them to the configuration).

You can drill down and see the metrics associated with the children as well. For example, the Memory Pool for the PS Old Gen has a metric "Pool Used Memory" that we can graph (the metric data was pulled from Jolokia, stored in Hawkular Metrics, which is then graphed by HawkFx as you see here):


Finally, you can use HawkFx to confirm that the resource configuration properties were successfully collected from Jolokia and stored into Hawkular. For example, here you can see the "Type" property we configured earlier - the type of this memory pool is "HEAP".


What this all shows is that you can use Hawkular WildFly Agent to collect resource information and metric data from JMX over a Jolokia endpoint and store that data inside Hawkular.