For more information, see: https://github.com/hawkular/hawkular-openshift-agent
Monday, November 21, 2016
Hawkular OpenShift Demo - Running Outside OpenShift
Below is a quick 8 minute demo of the Hawkular OpenShift Agent.
For more information, see: https://github.com/hawkular/hawkular-openshift-agent
For more information, see: https://github.com/hawkular/hawkular-openshift-agent
Monday, November 14, 2016
Hawkular OpenShift Agent - First Demo
Below is a quick 10 minute demo of the Hawkular OpenShift Agent.
For more information, see: https://github.com/hawkular/hawkular-openshift-agent
For more information, see: https://github.com/hawkular/hawkular-openshift-agent
Thursday, October 20, 2016
Hawkular OpenShift Agent is Born
A new Hawkular agent has been published on github.com - Hawkular OpenShift Agent.
It is implemented in Go and the main use case for which it was created is to be able to collect metrics from OpenShift pods. The idea is you run Hawkular OpenShift Agent (HOSA) on an OpenShift node and HOSA will listen for pods to come up and down on the node. As pods come online, the pods will tell the agent what (if any) metrics should be collected. As pods go down, the agent will stop collecting metrics from all endpoints running on that pod.
Today, only Prometheus endpoints (using either the binary or text protocol) can be scraped with Jolokia endpoints next on the list to be implemented. So HOSA will be able to support collecting metrics from either type of endpoint in the near future.
For more information - how to build and configure it - refer to the Hawkular OpenShift Agent README.
Monday, October 17, 2016
Pulling in a Go Dependency From a Fork, Branch, or Github PR using Glide
While writing a Go app, I decided to use Glide as the dependency management system (I tried Godep first, but even on the first day of using it, my dependencies were getting screwed up, lost, builds would mysteriously break - so I decided to switch to Glide, which seems much better).
I was using the Hawkular Go Client library because I needed to write metric data to Hawkular Metrics. So in my glide.yaml, I had this:
Anyway, I needed to add a feature to the Hawkular Go Client. So I forked the git repository, created a branch in my fork where I implemented the new feature, and submitted a Github pull request from my own branch. Rather than wait for the PR to be merged, I wanted Glide to pull in my own branch in my forked repo so I could immediately begin using the new feature. It was as simple as adding three lines to my glide.yaml and running "glide update":
Running "glide update" pulled in the Hawkuar Go client from my fork's branch and placed it in my vendors/ directory. I can now start using my new feature in my Go app without waiting for the PR to be merged. Once the PR is merged, I can remove those three lines, "glide update" again, and things should be back to normal.
I was using the Hawkular Go Client library because I needed to write metric data to Hawkular Metrics. So in my glide.yaml, I had this:
- package: github.com/hawkular/hawkular-client-goWhich simply tells Glide that I want to use the latest master of the client library (I'm not using a versioned library yet. I guess I should start doing that).
subpackages:
- metrics
Anyway, I needed to add a feature to the Hawkular Go Client. So I forked the git repository, created a branch in my fork where I implemented the new feature, and submitted a Github pull request from my own branch. Rather than wait for the PR to be merged, I wanted Glide to pull in my own branch in my forked repo so I could immediately begin using the new feature. It was as simple as adding three lines to my glide.yaml and running "glide update":
- package: github.com/hawkular/hawkular-client-goThis tells Glide that the Hawkular Go client package is now located at a different repository (my fork located at github.com) under a branch called "issue-8".
repo: git@github.com:jmazzitelli/hawkular-client-go.git
vcs: git
ref: issue-8
subpackages:
- metrics
Running "glide update" pulled in the Hawkuar Go client from my fork's branch and placed it in my vendors/ directory. I can now start using my new feature in my Go app without waiting for the PR to be merged. Once the PR is merged, I can remove those three lines, "glide update" again, and things should be back to normal.
Wednesday, October 5, 2016
Installing Open Shift Origin and Go for a Development Environment
The Hawkular team is doing some work to develop a Hawkular Agent for running within an Open Shift environment. Since the Go Programming Language ("Go") seems to be the language de jour and many things within the Open Shift infrastructure is developed in Go, the first attempt at this new Hawkular Agent will also be implemented in Go.
Because of this, I needed to get a development environment up and running that included both Open Shift and Go. This blog is simply my notes on how I did this.
INSTALL "GO"
Go isn’t necessary to install and run Open Shift, but because I want to write a Go application, I need it.
INSTALL CORE GO SYSTEM
* Create the directory where Go is to be installed
mkdir $HOME/bin/go-install (this is where Go will be installed)
* Create the Go workspace (GOPATH will end up pointing to here)
mkdir $HOME/source/go
mkdir $HOME/source/go/bin
mkdir $HOME/source/go/pkg
mkdir $HOME/source/go/src
* Download go package from https://golang.org/dl/
cd /tmp
wget https://storage.googleapis.com/golang/go1.7.1.linux-amd64.tar.gz
* Unpack the tar in the $HOME/bin/go-install - should end up inside a subdirectory "go"
cd $HOME/bin/go-install
tar xzvf /tmp/go*.tar.gz
* Set up your shell environment so you can run Go
** Put the following Inside .bashrc
export GOROOT=${HOME}/bin/go-install/go
export PATH=${PATH}:${GOROOT}/bin
export GOPATH=${HOME}/source/go
* Make sure Go is working before going on - run “go version” to confirm. I like to log completely out and then back in again so my bash script gets loaded for all my shells.
INSTALL ADDITIONAL GO TOOLS
* Download and install guru
cd $HOME/bin/go-install/go/bin
go get golang.org/x/tools/cmd/guru
go build golang.org/x/tools/cmd/guru
** The above puts the "guru" executable in your current directory (which should be $HOME/bin/go-install/go/bin)
* Download and install gocode
cd $HOME/bin/go-install/go/bin
go get github.com/nsf/gocode
go build github.com/nsf/gocode
** The above puts the "gocode" executable in your current directory (which should be $HOME/bin/go-install/go/bin)
* Download and install godef
cd $HOME/bin/go-install/go/bin
go get github.com/rogpeppe/godef
go build github.com/rogpeppe/godef
** The above puts the "godef" executable in your current directory (which should be $HOME/bin/go-install/go/bin)
* Download and install godep
cd $HOME/bin/go-install/go/bin
go get github.com/tools/godep
go build github.com/tools/godep
** The above puts the "godep" executable in your current directory (which should be $HOME/bin/go-install/go/bin)
* If you use Eclipse, install GoClipse:
** Plugin Site: http://goclipse.github.io/releases/
** Make sure the GoClipse configuration knows where your Go installation is along with your guru, gocode, and godef executables. See the Go configuration settings in Eclipse preferences.
INSTALL OPEN SHIFT
These instructions will install Open Shift in a virtual machine. So you need to get Vagrant and VirtualBox first before doing anything. And of course Vagrant needs Ruby 2 so you need that before anything. Then you install the Open Shift image.
Note that you may have to change your BIOS settings to enable virtualization. To avoid a VERR_VMX_MSR_ALL_VMX_DISABLED error, I had to do this on my Lenovo laptop in the Security->Virtualization section of the BIOS settings.
These notes follow the instructions found at https://www.openshift.org/vm
(October 5, 2016: Note that the instructions there tell you to not use Vagrant 1.8.5 nor VirtualBox 5.1 - unfortunately, they tell you this all the way at the bottom after the instructions. So if you start at the top and work your way down, you will be frustrated beyond belief until you decide to skip all the way to the bottom and realize this. I emailed the folks maintaining that page to put those notices at the top so people can see these warnings before they start downloading the wrong stuff.)
INSTALL RUBY
If you already have Ruby 2+ installed, you can skip this. This will install RVM and then use that to install Ruby 2. If you skip this step, make sure you have a Ruby 2 installation available before going on to installing and running Vagrant.
* Download and install RVM and Ruby
** You need to accept the GPG key for RVM and install RVM
gpg2 --keyserver hkp://keys.gnupg.net --recv-keys 409B6B1796C275462A1703113804BB82D39DC0E3
curl -L https://get.rvm.io | bash -s stable
rvm autolibs packages
** Now install Ruby 2
rvm install 2.3.0
rvm use --default 2.3.0
ruby -v
INSTALL VAGRANT
* Download and install Vagrant .rpm
** https://releases.hashicorp.com/vagrant/
cd /tmp
wget https://releases.hashicorp.com/vagrant/1.8.4/vagrant_1.8.4_x86_64.rpm
rpm -i vagrant_*.rpm
vagrant version
INSTALL VIRTUAL BOX
* Download and install Virtual Box
** https://www.virtualbox.org/wiki/Downloads
** https://www.virtualbox.org/wiki/Download_Old_Builds
** You must grab it from the Oracle yum repo - we first must add that repo to our system:
sudo wget -P /etc/yum.repos.d http://download.virtualbox.org/virtualbox/rpm/fedora/virtualbox.repo
** If anything goes wrong during the install, you'll want to update your system and reboot - so you may want to do this now:
dnf update
** Make sure the kernel version is expected - these should output the same version string - otherwise, reboot
rpm -qa kernel | sort -V | tail -n 1
uname -r
** Install VirtualBox now
dnf install VirtualBox-5.0
I ran into some problems when I tried to run VirtualBox before I realized I needed to download VirtualBox from the Oracle yum repo. If you download from, say, RPMFusion, these instructions may not work (they did not for me). If you run into problems, you might have to install some additional packages via dnf (such as kernel-devel, kernel-headers, dkms) and perform some additional magic which I do not know which explains why I received a Dreadful grade on my O.W.L. exam.
INSTALL THE OPEN SHIFT IMAGE
* Go to an empty directory where you want to prepare your Vagrantfile
mkdir ${HOME}/openshift
cd ${HOME}/openshift
* Create a Vagrant file that initializes the OpenShift image.
vagrant init openshift/origin-all-in-one
* Run Open Shift inside a VM within VirtualBox
vagrant up --provider=virtualbox
At this point you should have an OpenShift environment running. If any errors occur, a log message should tell you how you can proceed.
You will want to download the Open Shift command line client "oc". Rather than regurgitate the instructions here, simply log into Open Shift using the default "admin" user (password "admin") and go to https://10.2.2.2:8443/console/command-line and follow the instructions there to download, install, and use "oc".
Note that you can SSH into your VM by executing "vagrant ssh"
The Open Shift self-signed certificate found at "/var/lib/origin/openshift.local.config/master/ca.crt" can be used to authenticate clients.
UPGRADE OPEN SHIFT
Should you wish to upgrade the Open Shift VM in the future, the following steps should do it.
* Go to the directory where you ran the VM:
cd ${HOME}/openshift
* Update the image
vagrant box update --box openshift/origin-all-in-one
* Destroy and re-create the VM environment
vagrant destroy --force
vagrant up --provider=virtualbox
REMOVE OPEN SHIFT
Should you wish to remove the Open Shift VM in the future, the following steps should do it.
* Go to the directory where your Vagrantfile is
cd ${HOME}/openshift
* Remove Open Shift VM
vagrant halt
vagrant destroy --force
vagrant box remove --force openshift/origin-all-in-one
Tuesday, July 12, 2016
Collecting Prometheus Data and Storing in Hawkular
My last blog entry talked about how to collect JMX data via Jolokia and store that data in Hawkular. Another relatively unknown feature similar to that, which I will now describe in this blog entry, is the ability to collect Prometheus metric data and store that in Hawkular.
Prometheus is itself a metric collection and storage system. However, Prometheus data endpoints (that is, endpoints that emit Prometheus metric data) follow a specific format for the emitted metric data. The Hawkular WildFly Agent has the ability to parse this Prometheus metric data format and push that metric data for storage into Hawkular which can then, of course, be used by Hawkular and its clients (for the purposes of graphing the metric data, alerting on the metric data, etc.).
I will explain how you can quickly get Hawkular to collect metric data from any Prometheus endpoint and store that data into Hawkular.
First, you need a Prometheus endpoint that emits metric data! For this simple demo, I simply ran the Prometheus Server which itself emits metrics. I did this via docker:
1. Make sure your docker daemon is running: sudo docker daemon
2. Run the Prometheus Server docker image: sudo docker run -p 9090:9090 prom/prometheus
That's it! You now have a Prometheus Server running and listening on port 9090. To see the metrics it, itself, emits, go to http://localhost:9090/metrics. We'll be asking the Hawkular WildFly Agent to collect these metrics and push them into a Hawkular Server.
Second, you need to run a Hawkular Server. I won't go into details here on how to do that. Suffice it to say, either build or download a Hawkular Server distribution and run it (if it is not a developer build, make sure you run your external Cassandra Server prior to starting your Hawkular Server - e.g. sudo docker run cassandra -p 9042:9042).
Now you want to run a Hawkular WildFly Agent to collect some of that Prometheus metric data and store it in the Hawkular Server. In this demo, I'll be running the Swarm Agent, which is simply a Hawkular WildFly Agent packaged in a single jar that you can run as a standalone app. However, its agent subsystem configuration is the same as if you were running the agent in a full WildFly Server so the configuration I'll be describing can be used no matter how you have deployed your agent.
Rather than rely on the default configuration file that comes with the Swarm Agent I extracted the default configuration file and edited it as I describe below.
I deleted all the "-dmr" related configuration settings (metric-dmr, resource-type-dmr, remote-dmr, etc). I want my agent to only collect data from my Prometheus endpoint, so no need to define all these DMR metadata. (NOTE: the Swarm Agent configuration file does already, out-of-box, support Prometheus. I will skip that for this demo - I want to explicitly explain the parts of the agent configuration that is needed to be in the configuration file).
The Prometheus portion of the agent configuration is very small. Here it is:
Notice I can associate my managed server with metric tags (remote-prometheus is one type of "managed server"). For every metric that is collected for this remote-prometheus managed server, those tags will be added to those metrics in the Hawkular Server (specifically in the Hawkular Metrics component). All metrics will have these same tags. In addition, any labels associated with the emitted Prometheus metrics (Prometheus metric data can have name/value pairs associated with them - Prometheus calls these labels) will be added as Hawkular tags. Similarly, the ID used to store the metrics in the Hawkular Metric component can also be customized. Both metric-tags and metric-id-template are optional. You can also place those attributes on individual metric definitions (which I describe below) which is most useful if you have specific tags you want to add only to metrics of a specific metric type but not on all of the metrics collected for your managed server.
If you wish to have the agent only collect a subset of the metrics emitted by that endpoint, then you must tell the agent which metrics you want collected. You do this via metric sets:
OK, now that I've got my Swarm Agent configuration in place (call it "agent.xml" for simplicity), I can run the agent and point it to my configuration file:
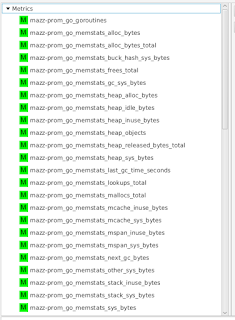
In order to visualize this collected data, I'm using the experimental developer tool HawkFX. This is simply a browser that let's you see what data is in Hawkular Inventory as well as Hawkular Metrics. When I log in, I can see all the metric data that comes directly from the Prometheus endpoint.
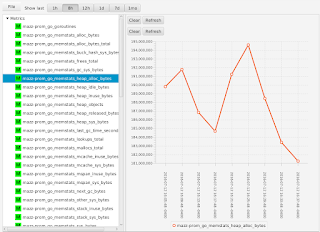
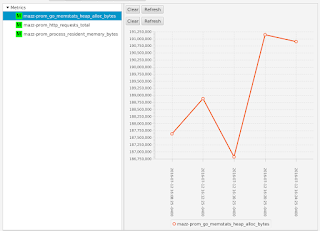
I can select a metric to see its graph:
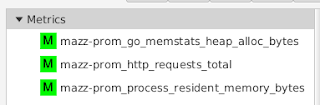
If I were to have configured my agent to only collect a subset of metrics (as I had shown earlier), I would see only those metrics that I asked to collect - all the other metrics emitted by the Prometheus endpoint are ignored:
What this all shows is that you can use Hawkular WildFly Agent to collect metric data from a Prometheus endpoint and store that data inside Hawkular.
Prometheus is itself a metric collection and storage system. However, Prometheus data endpoints (that is, endpoints that emit Prometheus metric data) follow a specific format for the emitted metric data. The Hawkular WildFly Agent has the ability to parse this Prometheus metric data format and push that metric data for storage into Hawkular which can then, of course, be used by Hawkular and its clients (for the purposes of graphing the metric data, alerting on the metric data, etc.).
I will explain how you can quickly get Hawkular to collect metric data from any Prometheus endpoint and store that data into Hawkular.
First, you need a Prometheus endpoint that emits metric data! For this simple demo, I simply ran the Prometheus Server which itself emits metrics. I did this via docker:
1. Make sure your docker daemon is running: sudo docker daemon
2. Run the Prometheus Server docker image: sudo docker run -p 9090:9090 prom/prometheus
That's it! You now have a Prometheus Server running and listening on port 9090. To see the metrics it, itself, emits, go to http://localhost:9090/metrics. We'll be asking the Hawkular WildFly Agent to collect these metrics and push them into a Hawkular Server.
Second, you need to run a Hawkular Server. I won't go into details here on how to do that. Suffice it to say, either build or download a Hawkular Server distribution and run it (if it is not a developer build, make sure you run your external Cassandra Server prior to starting your Hawkular Server - e.g. sudo docker run cassandra -p 9042:9042).
Now you want to run a Hawkular WildFly Agent to collect some of that Prometheus metric data and store it in the Hawkular Server. In this demo, I'll be running the Swarm Agent, which is simply a Hawkular WildFly Agent packaged in a single jar that you can run as a standalone app. However, its agent subsystem configuration is the same as if you were running the agent in a full WildFly Server so the configuration I'll be describing can be used no matter how you have deployed your agent.
Rather than rely on the default configuration file that comes with the Swarm Agent I extracted the default configuration file and edited it as I describe below.
I deleted all the "-dmr" related configuration settings (metric-dmr, resource-type-dmr, remote-dmr, etc). I want my agent to only collect data from my Prometheus endpoint, so no need to define all these DMR metadata. (NOTE: the Swarm Agent configuration file does already, out-of-box, support Prometheus. I will skip that for this demo - I want to explicitly explain the parts of the agent configuration that is needed to be in the configuration file).
The Prometheus portion of the agent configuration is very small. Here it is:
<managed-servers>That's it. <remote-prometheus> tells the agent where the Prometheus endpoint is and how often to pull the metric data from it. Every metric emitted by that Prometheus endpoint will be collected and stored in Hawkular.
<remote-prometheus name="My Prometheus Endpoint"
enabled="true"
interval="30"
time-units="seconds"
metric-tags="feed=%FeedId"
metric-id-template="%FeedId_%MetricName"
url="http://127.0.0.1:9090/metrics"/>
</managed-servers>
Notice I can associate my managed server with metric tags (remote-prometheus is one type of "managed server"). For every metric that is collected for this remote-prometheus managed server, those tags will be added to those metrics in the Hawkular Server (specifically in the Hawkular Metrics component). All metrics will have these same tags. In addition, any labels associated with the emitted Prometheus metrics (Prometheus metric data can have name/value pairs associated with them - Prometheus calls these labels) will be added as Hawkular tags. Similarly, the ID used to store the metrics in the Hawkular Metric component can also be customized. Both metric-tags and metric-id-template are optional. You can also place those attributes on individual metric definitions (which I describe below) which is most useful if you have specific tags you want to add only to metrics of a specific metric type but not on all of the metrics collected for your managed server.
If you wish to have the agent only collect a subset of the metrics emitted by that endpoint, then you must tell the agent which metrics you want collected. You do this via metric sets:
<metric-set-prometheus name="My Prometheus Metrics">Once you defined your metric-set-prometheus entries, you specify them in the metric-sets attribute on your <remote-prometheus> element (e.g. metric-sets="My Prometheus Metrics").
<metric-prometheus name="http_requests_total" />
<metric-prometheus name="go_memstats_heap_alloc_bytes" />
<metric-prometheus name="process_resident_memory_bytes" />
</metric-set-prometheus>
OK, now that I've got my Swarm Agent configuration in place (call it "agent.xml" for simplicity), I can run the agent and point it to my configuration file:
java -jar hawkular-swarm-agent-dist-*-swarm.jar agent.xmlAt this point I have my agent running along side of my Hawkular Server and the Prometheus Server which is the source of our metric data. The agent is collecting information from the Prometheus endpoint and pushing the collected data to Hawkular Server.
In order to visualize this collected data, I'm using the experimental developer tool HawkFX. This is simply a browser that let's you see what data is in Hawkular Inventory as well as Hawkular Metrics. When I log in, I can see all the metric data that comes directly from the Prometheus endpoint.

I can select a metric to see its graph:

If I were to have configured my agent to only collect a subset of metrics (as I had shown earlier), I would see only those metrics that I asked to collect - all the other metrics emitted by the Prometheus endpoint are ignored:


What this all shows is that you can use Hawkular WildFly Agent to collect metric data from a Prometheus endpoint and store that data inside Hawkular.
Collecting JMX Data and Storing in Hawkular
The Hawkular WildFly Agent has the ability to not only monitor WildFly Servers but also JMX MBean Servers via Jolokia (and also Prometheus endpoints, but that's for another blog - let's focus on Jolokia-enabled JMX MBean Servers for now).
What this means is if you have a Jolokia-enabled server, you can collect JMX data from it and store that data in Hawkular. This includes both metric data as well as resource information.
This blog will attempt to quickly show how this is done.
First, you need a Jolokia-enabled server! For this demo, here's the quick steps I did to get this running on my box:
1. I downloaded WildFly 10.0.0.Final and unzipped it.
2. I downloaded the latest Jolokia .war file and copied it to my new WildFly Server's standalone/deployments directory
3. I started my WildFly Server and bound it to some IP address that I dedicated to it (in this case, it was simply a loopback IP that I dedicated to this WildFly Server):
bin/standalone.sh -b 127.0.0.5 -bmanagement=127.0.0.5
At this point, I now have a server with some JMX data exposed over the Jolokia endpoint.
Second, I need to run a Hawkular Server. I won't go into details here on how to do that. Suffice it to say, either build or download a Hawkular Server distribution and run it (if it is not a developer build, make sure you run your external Cassandra Server prior to starting your Hawkular Server - e.g. sudo docker run cassandra -p 9042:9042).
Now I want to run a Hawkular WildFly Agent to collect some of that JMX data from my WildFly Server and store it in Hawkular Server. In this demo, I'll be running the Swarm Agent, which is simply a Hawkular WildFly Agent packaged in a single jar that you can run as a standalone app. However, its agent subsystem configuration is the same as if you were running the agent in a full WildFly Server so the configuration I'll be describing can be used no matter how you have deployed your agent.
Rather than rely on the default configuration file that comes with the Swarm Agent (which is designed to collect and store data from a WildFly Server's DMR management endpoint, not Jolokia) I extracted the default configuration file and edited it as I describe below.
I deleted all the "-dmr" related configuration settings (metric-dmr, resource-type-dmr, remote-dmr, etc). I want my agent to only collect data from my Jolokia endpoint, so no need to define all these DMR metadata.
I then added metadata that describes the JMX data I want to collect. For example, I collect availability metrics (to tell me if an MBean is available or not) and gauge metrics (to graph things like used memory). I also collect resource properties that some MBeans expose as JMX attributes. I assign these to different resources by defining resource metadata which point to specific JMX MBean ObjectNames. I then define the details of my Jolokia-enabled WildFly Server in a <remote-jmx> so my agent knows where my Jolokia-enabled WildFly Server is.
Some example configuration is:
Here is an example of a gauge metric:
You group availability metrics and numeric metrics in metric sets (avail-set-jmx and metric-set-jmx respectively) and then associate those metric sets to specific resource types. Resource types define resources that you want to monitor (resources in JMX are simply MBeans identified with ObjectNames). For example, in my demo, I want to monitor my Memory Pools. So I create a resource type definition that describe the Memory Pools:
Once all of my metadata is configured (I've configured the agent to collect all the configuration properties, availability and numeric metrics of all the JMX MBeans I want), I now configure the agent with the Jolokie-enabled endpoint. This tells the agent how to connect to the Jolokia endpoint and what I want the agent to monitor in that endpoint:
One final note before I run the agent. Notice I can associate my managed server with metric tags (remote-jmx is one type of "managed server"). For every metric that is collected for this remote-jmx managed server, those tags will be added to those metrics in the Hawkular Server (specifically in the Hawkular Metrics component). So for the "Pool Used Memory" metric I defined earlier, when that metric is stored in the Hawkular Server, it will be tagged with "server" and "host" where the values of those tags are the name of my managed server (in this case, %ManagedServerName is replaced with "My Remote JMX") and "127.0.0.5" respectively. All metrics will have the same tags. Similarly, the ID used to store the metrics in the Hawkular Metric component can also be customized though this is a rarely used feature and you probably will never need it. Both metric-tags and metric-id-template are optional. You can also place those attributes on individual metrics which is most useful if you have specific tags you want to add only to metrics of a specific metric type but not on all of the metrics collected for your managed server.
OK, now that I've got my Swarm Agent configuration in place (call it "agent.xml" for simplicity), I can run the agent and point it to my configuration file:
In order to visualize this collected data, I'm using the experimental developer tool HawkFX. This is simply a browser that let's you see what data is in Hawkular Inventory as well as Hawkular Metrics. When I log in, I can see all the resources stored in Hawkular that comes directly from Jolokia - these resources represent the different JMX MBeans we asked the agent to monitor:

You can see "My Remote JMX Runtime MBean" is my parent resource, it has one availability metric "VM Avail", three numeric metrics and six child resources (those are the Memory Pool resources described above when we added them to the configuration).
You can drill down and see the metrics associated with the children as well. For example, the Memory Pool for the PS Old Gen has a metric "Pool Used Memory" that we can graph (the metric data was pulled from Jolokia, stored in Hawkular Metrics, which is then graphed by HawkFx as you see here):

Finally, you can use HawkFx to confirm that the resource configuration properties were successfully collected from Jolokia and stored into Hawkular. For example, here you can see the "Type" property we configured earlier - the type of this memory pool is "HEAP".

What this all shows is that you can use Hawkular WildFly Agent to collect resource information and metric data from JMX over a Jolokia endpoint and store that data inside Hawkular.
What this means is if you have a Jolokia-enabled server, you can collect JMX data from it and store that data in Hawkular. This includes both metric data as well as resource information.
This blog will attempt to quickly show how this is done.
First, you need a Jolokia-enabled server! For this demo, here's the quick steps I did to get this running on my box:
1. I downloaded WildFly 10.0.0.Final and unzipped it.
2. I downloaded the latest Jolokia .war file and copied it to my new WildFly Server's standalone/deployments directory
3. I started my WildFly Server and bound it to some IP address that I dedicated to it (in this case, it was simply a loopback IP that I dedicated to this WildFly Server):
bin/standalone.sh -b 127.0.0.5 -bmanagement=127.0.0.5
At this point, I now have a server with some JMX data exposed over the Jolokia endpoint.
Second, I need to run a Hawkular Server. I won't go into details here on how to do that. Suffice it to say, either build or download a Hawkular Server distribution and run it (if it is not a developer build, make sure you run your external Cassandra Server prior to starting your Hawkular Server - e.g. sudo docker run cassandra -p 9042:9042).
Now I want to run a Hawkular WildFly Agent to collect some of that JMX data from my WildFly Server and store it in Hawkular Server. In this demo, I'll be running the Swarm Agent, which is simply a Hawkular WildFly Agent packaged in a single jar that you can run as a standalone app. However, its agent subsystem configuration is the same as if you were running the agent in a full WildFly Server so the configuration I'll be describing can be used no matter how you have deployed your agent.
Rather than rely on the default configuration file that comes with the Swarm Agent (which is designed to collect and store data from a WildFly Server's DMR management endpoint, not Jolokia) I extracted the default configuration file and edited it as I describe below.
I deleted all the "-dmr" related configuration settings (metric-dmr, resource-type-dmr, remote-dmr, etc). I want my agent to only collect data from my Jolokia endpoint, so no need to define all these DMR metadata.
I then added metadata that describes the JMX data I want to collect. For example, I collect availability metrics (to tell me if an MBean is available or not) and gauge metrics (to graph things like used memory). I also collect resource properties that some MBeans expose as JMX attributes. I assign these to different resources by defining resource metadata which point to specific JMX MBean ObjectNames. I then define the details of my Jolokia-enabled WildFly Server in a <remote-jmx> so my agent knows where my Jolokia-enabled WildFly Server is.
Some example configuration is:
<avail-jmx name="Memory Pool Avail"This defines an availability metric that says for the attribute "Valid" if its value matches the regex "[tT].*" consider its availability UP (note this regex matches the string "true", case-insensitive), otherwise it is DOWN. We will attach this availability metric to a resource below.
interval="30"
time-units="seconds"
attribute="Valid"
up-regex="[tT].*"/>
Here is an example of a gauge metric:
<metric-jmx name="Pool Used Memory"Notice the data can come from a sub-attribute of a composite value (the "used" value within the composite attribute "Usage").
interval="1"
time-units="minutes"
metric-units="bytes"
attribute="Usage#used"/>
You group availability metrics and numeric metrics in metric sets (avail-set-jmx and metric-set-jmx respectively) and then associate those metric sets to specific resource types. Resource types define resources that you want to monitor (resources in JMX are simply MBeans identified with ObjectNames). For example, in my demo, I want to monitor my Memory Pools. So I create a resource type definition that describe the Memory Pools:
<resource-type-jmx name="Memory Pool MBean"Here you can see my resource type "Memory Pool Bean" refers to all resources that match the JMX query "java.lang:type=MemoryPool,name=*". For all the resources that match that query, I associate with them the availability and numeric metrics defined in the sets mentioned in the metric-sets and avail-sets attributes. I also want a resource configuration property collected for each resource - "Type". Each Memory Pool MBean has a Type attribute that we want to collect and store. Notice also that all of these resources are to be considered children of the parent resource whose resource type name is "Runtime MBean" (which I defined elsewhere in my configuration).
parents="Runtime MBean"
resource-name-template="%type% %name%"
object-name="java.lang:type=MemoryPool,name=*"
metric-sets="MemoryPoolMetricsJMX"
avail-sets="MemoryPoolAvailsJMX"
<resource-config-jmx name="Type"
attribute="Type"/>
</resource-type-jmx>
Once all of my metadata is configured (I've configured the agent to collect all the configuration properties, availability and numeric metrics of all the JMX MBeans I want), I now configure the agent with the Jolokie-enabled endpoint. This tells the agent how to connect to the Jolokia endpoint and what I want the agent to monitor in that endpoint:
<remote-jmx name="My Remote JMX"Here I configure the URL endpoint of my WildFly Server's Jolokia war. I then tell it what resource types I want to monitor in that Jolokia endpoint (I've grouped all my resource types into two different resource type sets called MainJMX and MemoryPoolJMX). The grouping is all up to you - if you want one big resource type set, that's fine. For metrics, you can have one big availability metric set and one big numeric metric set - it doesn't matter how you organize your sets.
enabled="true"
resource-type-sets="MainJMX,MemoryPoolJMX"
metric-tags="server=%ManagedServerName,host=127.0.0.5"
metric-id-template="%ResourceName_%MetricTypeName"
url="http://127.0.0.5:8080/jolokia-war-1.3.3"/>
One final note before I run the agent. Notice I can associate my managed server with metric tags (remote-jmx is one type of "managed server"). For every metric that is collected for this remote-jmx managed server, those tags will be added to those metrics in the Hawkular Server (specifically in the Hawkular Metrics component). So for the "Pool Used Memory" metric I defined earlier, when that metric is stored in the Hawkular Server, it will be tagged with "server" and "host" where the values of those tags are the name of my managed server (in this case, %ManagedServerName is replaced with "My Remote JMX") and "127.0.0.5" respectively. All metrics will have the same tags. Similarly, the ID used to store the metrics in the Hawkular Metric component can also be customized though this is a rarely used feature and you probably will never need it. Both metric-tags and metric-id-template are optional. You can also place those attributes on individual metrics which is most useful if you have specific tags you want to add only to metrics of a specific metric type but not on all of the metrics collected for your managed server.
OK, now that I've got my Swarm Agent configuration in place (call it "agent.xml" for simplicity), I can run the agent and point it to my configuration file:
java -jar hawkular-swarm-agent-dist-*-swarm.jar agent.xmlAt this point I have my agent running along side of my Hawkular Server and WildFly Server enabled with Jolokia. The agent is collecting information from Jolokia and pushing the collected data to Hawkular Server.
In order to visualize this collected data, I'm using the experimental developer tool HawkFX. This is simply a browser that let's you see what data is in Hawkular Inventory as well as Hawkular Metrics. When I log in, I can see all the resources stored in Hawkular that comes directly from Jolokia - these resources represent the different JMX MBeans we asked the agent to monitor:

You can see "My Remote JMX Runtime MBean" is my parent resource, it has one availability metric "VM Avail", three numeric metrics and six child resources (those are the Memory Pool resources described above when we added them to the configuration).
You can drill down and see the metrics associated with the children as well. For example, the Memory Pool for the PS Old Gen has a metric "Pool Used Memory" that we can graph (the metric data was pulled from Jolokia, stored in Hawkular Metrics, which is then graphed by HawkFx as you see here):

Finally, you can use HawkFx to confirm that the resource configuration properties were successfully collected from Jolokia and stored into Hawkular. For example, here you can see the "Type" property we configured earlier - the type of this memory pool is "HEAP".

What this all shows is that you can use Hawkular WildFly Agent to collect resource information and metric data from JMX over a Jolokia endpoint and store that data inside Hawkular.
Monday, April 18, 2016
Prometheus Metric Endpoint Parser for Java
I have a need for a Java-based parser that can parse metric data from any Prometheus endpoint.
Prometheus has two main data formats - a binary format and a text format. You can read about those formats here. That document says that "Clients must support at least one of these two alternate formats." So I needed a Java-based parser that can parse both.
The Prometheus team has published parsers for several different languages (e.g. C++, Go, Python, Ruby, and Java). Some only support the binary formats, Java being one of those with only binary support. In addition, the Prometheus team may delete the Java parser entirely since it is relatively unused by the community. As of this writing, the latest release of the Prometheus Java parser is version 0.0.2 from July 2013 which also doesn't support histograms (though version 0.0.3-SNAPSHOT in the master branch does support it - so if/when 0.0.3 is released, histogram support will be avaialble).
So I needed to write my own Java-based parser for the text format to ensure I could read any Prometheus metric endpoint (even though the documentation says clients must support one or the other, in practice it seems all endpoints support the text format and only some (mainly Go endpoints) support the binary format). So even if the Java-based binary parser support goes away, having a text parser should still be able to read all Prometheus endpoints (in other words, those endpoints with binary-format support should also have text-format support as well).
Here is my Java-based Prometheus Metrics Scraper code. There is a README for a quick synopsis. It supports both binary and text formats and utilizes content negotiation with the URL endpoint to determine what format to expect. You can also programatically process files as opposed to URL endpoints.
This Prometheus Metrics Scraper comes with a CLI that you can run via a simple Java command:
Programmatically you use this by simply passing a URL (or File) to PrometheusScraper and calling its scrape() method. This will return a list of MetricFamily objects, which contain all the metric data found in the endpoint URL.
See the code's Javadoc for more complete documentation.
There are a few things still missing that would be nice to enhance for the future.
First is histogram support for binary formatted data (but once the jar artifact "io.prometheus.client:model" version 0.0.3 is released by the Prometheus team, it would just be a matter of uncommenting one block of code for my Java-based parser to begin supporting it). Of course, histograms are fully supported in the text parser.
Secondly, the URL endpoint is assumed to be unsecured. If SSL certificates or authentication is required to access the metric data over the given URL, the scraper will fail to process the data.
Prometheus has two main data formats - a binary format and a text format. You can read about those formats here. That document says that "Clients must support at least one of these two alternate formats." So I needed a Java-based parser that can parse both.
The Prometheus team has published parsers for several different languages (e.g. C++, Go, Python, Ruby, and Java). Some only support the binary formats, Java being one of those with only binary support. In addition, the Prometheus team may delete the Java parser entirely since it is relatively unused by the community. As of this writing, the latest release of the Prometheus Java parser is version 0.0.2 from July 2013 which also doesn't support histograms (though version 0.0.3-SNAPSHOT in the master branch does support it - so if/when 0.0.3 is released, histogram support will be avaialble).
So I needed to write my own Java-based parser for the text format to ensure I could read any Prometheus metric endpoint (even though the documentation says clients must support one or the other, in practice it seems all endpoints support the text format and only some (mainly Go endpoints) support the binary format). So even if the Java-based binary parser support goes away, having a text parser should still be able to read all Prometheus endpoints (in other words, those endpoints with binary-format support should also have text-format support as well).
Here is my Java-based Prometheus Metrics Scraper code. There is a README for a quick synopsis. It supports both binary and text formats and utilizes content negotiation with the URL endpoint to determine what format to expect. You can also programatically process files as opposed to URL endpoints.
This Prometheus Metrics Scraper comes with a CLI that you can run via a simple Java command:
java -jar prometheus-scraper*-cli.jar [--simple | --xml | --json] {url}It can output any URL endpoint's metric data in several formats (JSON and XML being the two more interesting ones). If you'd like to try it out, grab the latest release from here and run it. For example, you can download the 0.17.1Final CLI jar here.
Programmatically you use this by simply passing a URL (or File) to PrometheusScraper and calling its scrape() method. This will return a list of MetricFamily objects, which contain all the metric data found in the endpoint URL.
See the code's Javadoc for more complete documentation.
There are a few things still missing that would be nice to enhance for the future.
First is histogram support for binary formatted data (but once the jar artifact "io.prometheus.client:model" version 0.0.3 is released by the Prometheus team, it would just be a matter of uncommenting one block of code for my Java-based parser to begin supporting it). Of course, histograms are fully supported in the text parser.
Secondly, the URL endpoint is assumed to be unsecured. If SSL certificates or authentication is required to access the metric data over the given URL, the scraper will fail to process the data.
Thursday, January 21, 2016
Hawkular Command Gateway Clients
This document is to briefly explain how clients can use the command gateway to send requests to the Hawkular Server and receive responses. The typical use case (though certainly not the only way to use this feature) is for a browser to send requests to Hawkular WildFly Agents routed through the Hawkular Server, with the agent’s responses routed back to the browser (back through the server intermediary) that sent the request.
:8080/ui/ws".
Note that a secure connection via SSL can be made by connecting to “wss://:8443” but this requires the server to be configured properly with a certificate and a security realm defined. Such details are out of scope for this document. For more, see http://www.hawkular.org/docs/user/secure-comm.html
An example WelcomeResponse message that a client could receive is:
The WelcomeResponse JSON schema is defined here.
Within the JSON content, there must be an authentication node containing the credentials of the client. The authentication node’s JSON schema is defined here.
So, for example, if you want to execute the “Undeploy” operation on a web deployment resource, the request sent over the web socket connection will look something like this:
Note that in order for a client to request something related to a specific resource in inventory, that client must know the resource’s “resource path” as defined in Hawkular Inventory. See the Hawkular Inventory REST API documentation for more details on how to obtain inventory data such as these resource paths.
For example, when a client sends a request message destined to an agent, the server will immediately send a GenericSuccessResponse back to the client. This means the request was received by the server and has been successfully forward to the agent (note: it does not mean the request was successfully processed by the agent - the agent will send its own success or failure response message back once it processes the original request). Such a response message received by the client would look like this:
Brief Summary
The typical workflow is the following:- Client makes a websocket connection to the server.
- Client immediately receives a WelcomeResponse JSON message from the server notifying the client what its session ID is.
- Client can send JSON requests over the Web Socket connection.
- Client can receive JSON responses over the Web Socket connection. These messages are received asynchronous from its requests and may not even be tied to a specific request.
- Client can keep the connection open as long as it wants, and can disconnect when it wants.
Make the Connection
Clients first need to make a WebSocket connection to the Hawkular Server. That is done by connecting to the URL: "ws://Note that a secure connection via SSL can be made by connecting to “wss://
Receiving the Welcome Message
For each client websocket connection that is made, the server sends an initial WelcomeResponse message immediately to it. This message contains the client’s session ID. This is the session ID that the server will use to identify that client. This session ID is actually not needed by the client today, but it is available for future functionality. For now, clients can actually ignore this session ID.An example WelcomeResponse message that a client could receive is:
WelcomeResponse={“sessionId”:”abc:123:xyz:789”}
The WelcomeResponse JSON schema is defined here.
Sending a Request Message
Once connected, clients can immediately begin sending any valid request over the web socket connection. Because clients are able to send in different kinds of requests, the client must ensure the request message’s JSON content is prefixed with the JSON schema name followed by “=” . Valid JSON schemas can be found here.Within the JSON content, there must be an authentication node containing the credentials of the client. The authentication node’s JSON schema is defined here.
So, for example, if you want to execute the “Undeploy” operation on a web deployment resource, the request sent over the web socket connection will look something like this:
ExecuteOperationRequest={“authentication”:{“username”:”joe”,”password”:”pw”},“operationName”:”Undeploy”,”resourcePath”:”/t;tenant-id/e;env-id/r;resource-id-of-the-deployment-resource”}
Note that in order for a client to request something related to a specific resource in inventory, that client must know the resource’s “resource path” as defined in Hawkular Inventory. See the Hawkular Inventory REST API documentation for more details on how to obtain inventory data such as these resource paths.
Receiving a Response Message
The clients can receive messages in the same format as it sent them. In other words, the JSON content received by the client will be prefixed with the JSON schema name that is to be used to properly parse the JSON content received.For example, when a client sends a request message destined to an agent, the server will immediately send a GenericSuccessResponse back to the client. This means the request was received by the server and has been successfully forward to the agent (note: it does not mean the request was successfully processed by the agent - the agent will send its own success or failure response message back once it processes the original request). Such a response message received by the client would look like this:
GenericSuccessResponse={“message”:”The request has been forwarded to the feed [foo]”}
Sending Binary Content
Sometimes a client needs to send raw binary data as part of a request (e.g. when a client wants to deploy a web application, it sends a DeployApplicationRequest along with the application’s .war file). To do this, the client sends the JSON message as usual (i.e. in the form “json-schema={json content}”) but immediately following the final curly brace of the JSON content, the client should stream the binary content.Friday, January 1, 2016
Hawkular WildFly Agent API For Your Own Inventory and Metrics
The Hawkular WildFly Agent is well into development and is coming along nicely. It provides a way to monitor one or more WildFly or EAP application servers (including the one it is deployed into). It communicates with a Hawkular Server where the agent stores its inventory and metric data via the Hawkular Inventory and Hawkular Metrics components. You can use the Hawkular GUI to interact with your managed application servers: view historical graphs of metric data, deploy and undeploy applications, etc.
But the Hawkular WildFly Agent provides a hidden gem that might be useful to those developers that want to store metrics in a metric storage facility for later reporting and graphing but don't want to take the time to implement that storage facility. This hidden gem also provides a way for developers to store their own managed resource definitions in an inventory storage facility but, again, don't want to implement all of the backend required for such a thing.
The Hawkular WildFly Agent already integrates with Hawkular Inventory and Hawkular Metrics - this is to enable the agent to be able to store its own inventory and metrics. It makes sense to open that up for applications to use so they, too, can store inventory and metrics. To allow for this, Hawkular WildFly Agent stores a helpful object in JNDI called HawkularWildFlyAgentContext under the name "java:global/hawkular/agent/api" (side note: the agent can be told to bind this object to a different JNDI name if you want; it can also be told to not bind this hidden gem in JNDI at all if you do not wish to expose this feature).
The API this exposes is very simple - you can store or remove resources from inventory, and you can store metric data and availability data (availability data is just a "special" kind of metric that allows you to store "UP", "DOWN" or "UNKNOWN" availability states).
Any application that is deployed in the same WildFly or EAP application server as the agent can use this API by obtaining the agent context object via JNDI. A simple example of how you can obtain this agent context object from JNDI can be seen in a test war that is used in the agent integration tests - its a singleton EJB that gets this context object injected via @Resource. See the HawkularWildFlyAgentProvider class.
Once that HawkularWildFlyAgentContext object is obtained, your application can use it to store inventory, metric, and availability data. Note that you do not have to use all of these. For example, if you just want to store metrics in a historical time-based data store, just use the Metric Storage API that you get from the agent context object. This will send your data for storage to Hawkular Metrics. You could then do whatever you want with your data later - Hawkular Metrics provides a REST interface and some clients that you can use to query and report on your metric data.
The example test war can show you how the API is used to do these things - see the test MyAppServlet.java. This is just for integration testing, so it doesn't do anything earth-shattering, but it does show you how the API is used to create and remove managed resources from inventory, store metric data, and store availability data.
This feature of the Hawkular WildFly Agent is a relatively minor feature considering all the other main requirements that the agent must fulfill, but since it is rather hidden I decided to talk about it here.
Subscribe to:
Posts (Atom)